Use the Analytics dashboard to get insights into how your users interact with the CMP. Keep track of important CMP KPIs to maximize data capture and study how your CMP configuration choices impact user behavior.

Analyse your users' consent decisions
Overall and Daily Opt-in Rates |
Category Specific Rates |
Service Specific Rates |
Granular Analytics vs. Interaction Analytics
Usercentrics provides two different ways to gain detailed insights into your users' behaviour: Interaction Analytics and Granular Analytics.
Interaction Analytics gives you insights into how users react to your CMP and allows you to monitor the impact of setup changes you make. The Interaction Analytics Dashboard provides you with general KPIs of the CMP on your website, such as Interaction Rates or Accept All Rates. The provided data and graphs allow you to take data-driven business decisions and help you
to easily keep track of the most relevant KPIs.
to monitor the overall success of your CMP strategy.
to get insights on how the CMP setup impacts the interactions of your website users.
Granular Analytics provides you with granular data based on single consent decisions for Data Processing Services. Consent decisions are explicit decisions made by users who have interacted with the CMP by clicking Accept, Deny or Save. Users who do not interact with the CMP do not take any consent decisions. The provided data and graphs allow you to get the full picture of your users' behaviour and help you
to identify the right category for your DPS to improve the consent for specific services.
to better understand how the consent rate for individual DPS is composed in order to improve your data-driven decision-making.
Dashboards
The following dashboards provide distinctive insights into the users' consent decisions on category and service level.
KPI Overview
Get an overview of the total amount of consent decisions and the overall opt-in rate. 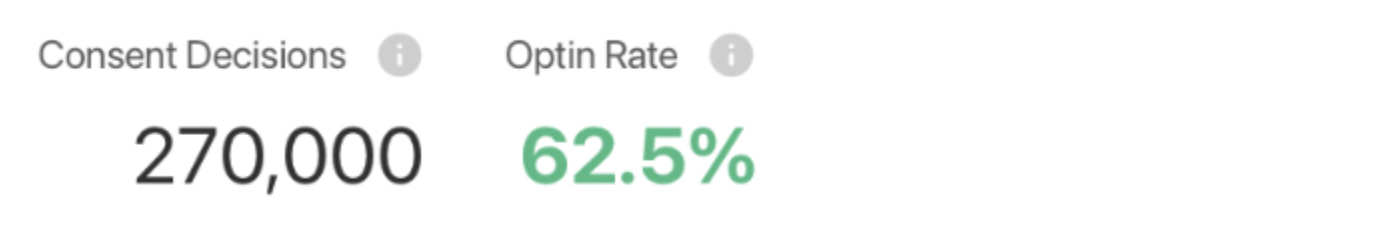
Consent Decisions: The total amount of taken consent decisions (opt-in & opt-out). A click on the accept all (deny all/save) button will cause an individual consent decision (opt-in or opt-out) for each Data Processing Service added to the CMP.
Opt-in Rate: The percentage of opt-ins in all consent decisions for all Data Processing Services → (opt-ins) / (opt-ins + opt-outs)
Overall Consent Decisions
Get an overview of the distribution of the total consent decisions. 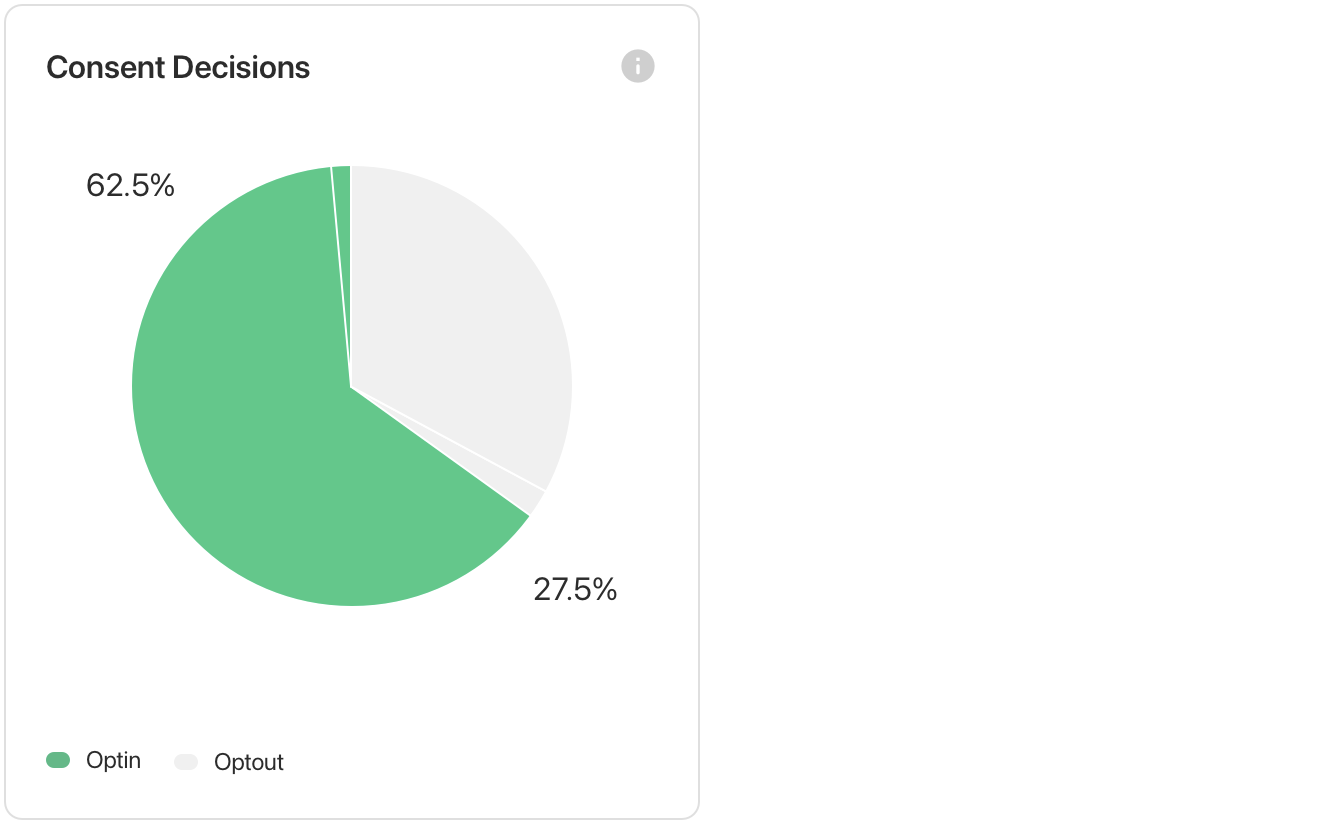
Optin: Percentage of consent decisions with an opt-in.
Accept all: Consent decision taken via accept-all button.
Granular Accept: Consent decision taken via save button.
Essential (Deny All): Consent decisions taken via deny-all button for services in an essential category.
Optout: Percentage of consent decisions with an opt-out.
Deny all: Consent decision taken via deny-all button.
Granular Deny: Consent decision taken via save button.
Daily Optin Rate
Get insights into the daily overall opt-in rate trend. 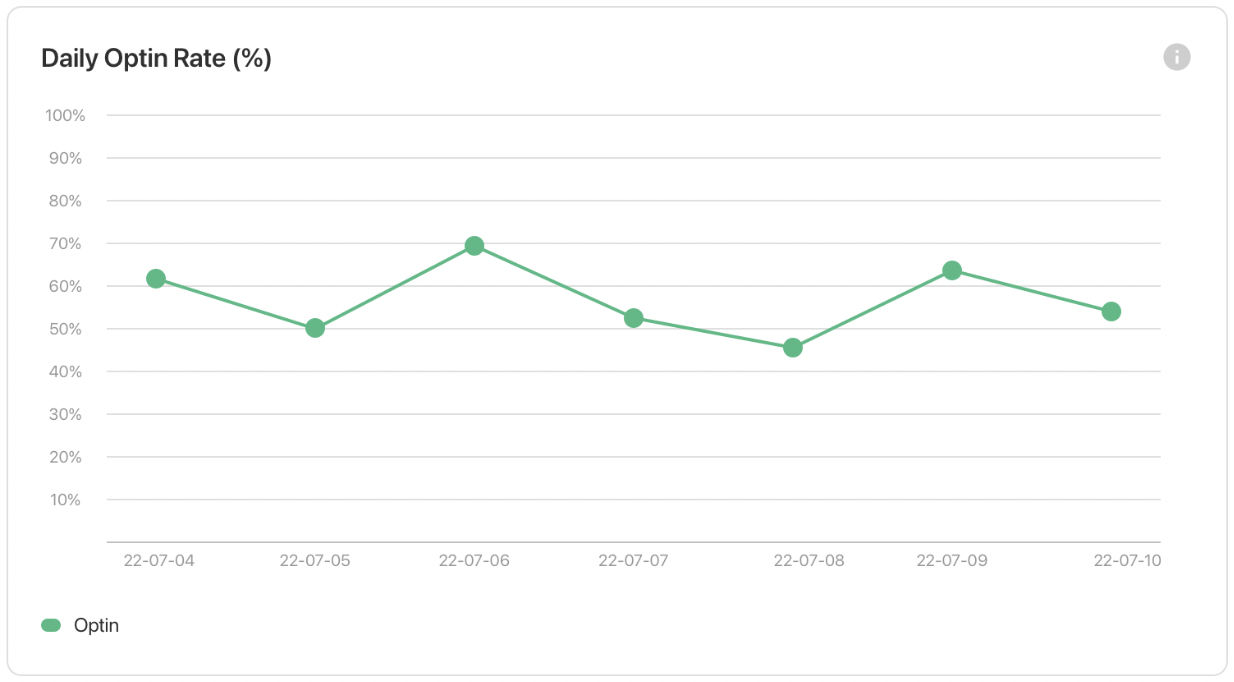
Daily Opt-in Rate: The overall daily percentage of opt-ins in all consent decisions → (opt-ins) / (opt-ins + opt-outs)
Category Overview
Get an overview of the distribution of the total consent decisions for a specific category. 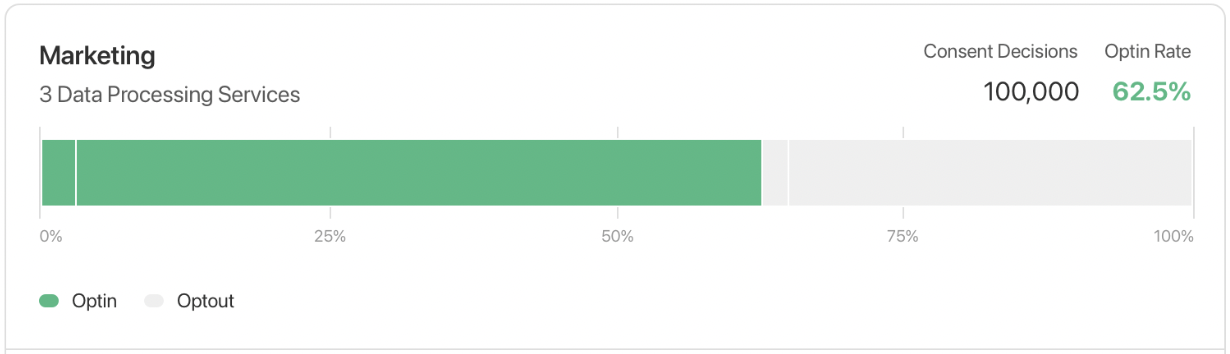
Consent Decisions: Total amount of consent decisions for services in the respective category.
Opt-in Rate: The percentage of opt-ins in all consent decisions for services in the respective category → (opt-ins) / (opt-ins + opt-outs)
Optin: Percentage of consent decisions with opt-in for services in the respective category.
Accept all: Consent decision taken via accept-all button.
Granular Accept: Consent decision taken via save button.
Essential (Deny All): Consent decisions taken via deny-all button for services in an essential category
(⚠️ only applies for an essential category).
Optout: Percentage of consent decisions with opt-out for services in the respective category.
Deny all: Consent decision taken via deny-all button.
Granular Deny: Consent decision taken via save button.
Category Trend
Get insights into the daily opt-in rate trend on the category level. 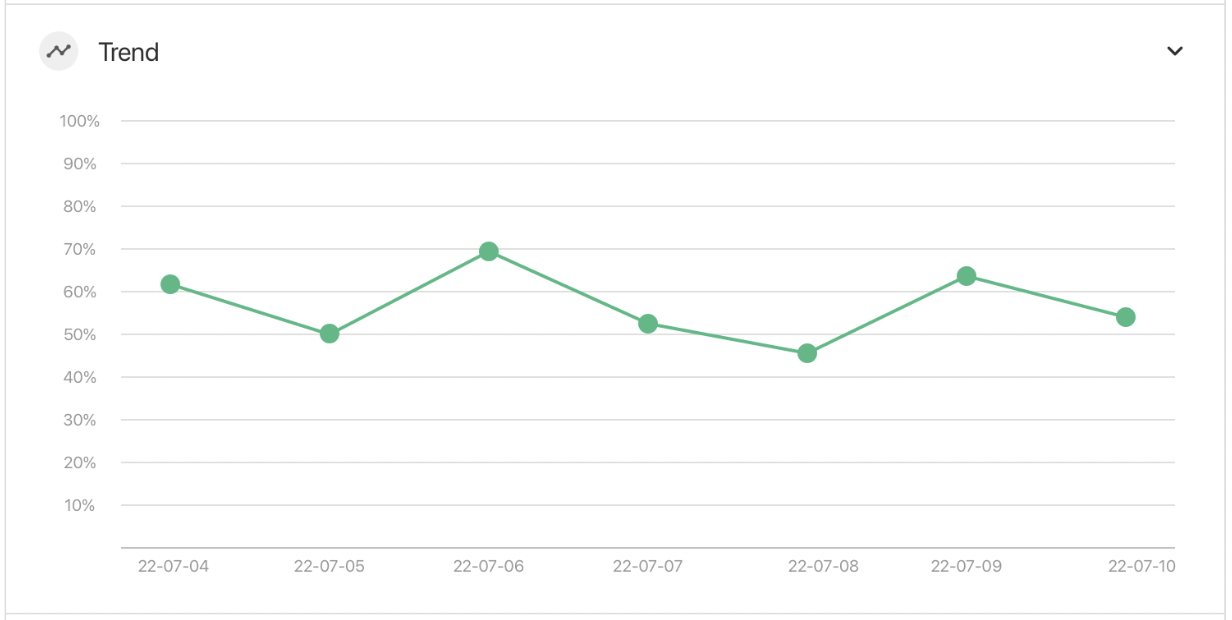
Daily Opt-in Rate: The daily percentage of opt-ins in all consent decisions → (opt-ins) / (opt-ins + opt-outs)
Consideration of consent decisions only for services within the respective category (e.g. marketing).
Data Processing Services Overview
Get insights on the absolute numbers and distribution of consent decisions for a specific service. 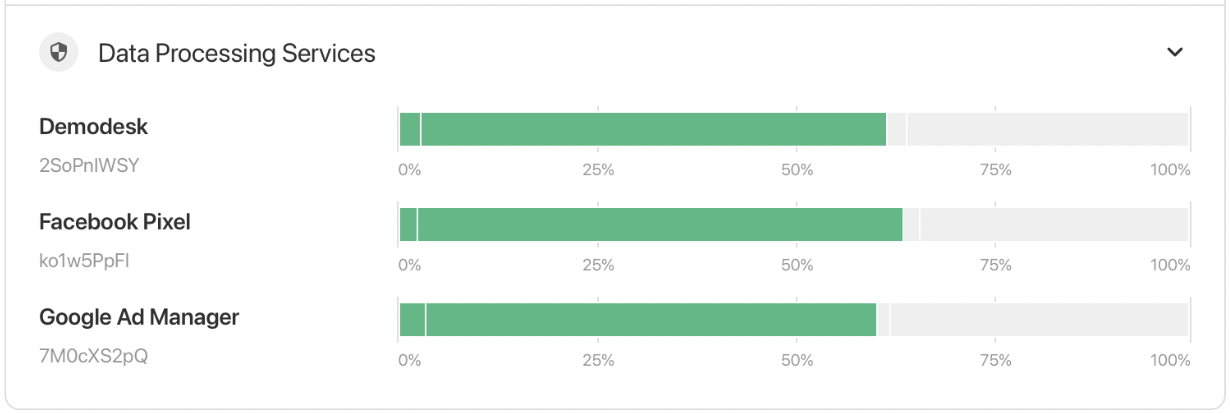
Consideration only for services within the respective category (e.g. marketing).
Optin: Percentage of consent decisions with opt-in for the respective service.
Accept all: Consent decision taken via accept-all button.
Granular Accept: Consent decision taken via save button.
Essential (Deny All): Consent decisions taken via deny-all button for services in an essential category
(⚠️ only applies for services in an essential category).
Optout: Percentage of consent decisions with opt-out for the respective service.
Deny all: Consent decision taken via deny-all button.
Granular Deny: Consent decision taken via save button.
Filter Options
The following available filter options will be applied to all graphs and the raw data download:
Time Range: Filter for a specific time range within the last 90 days.
Country: Filter for consent decisions of users from specific countries.
Browser: Filter for a specific browser.
Exclude Essential Services: When selected consent decisions for services in essential categories will be excluded from the graphs and all essential categories will be hidden.
FAQ
Why are there more consent decisions than interactions?
When clicking on the accept button 1 interaction (Accept all) will be counted. However, interacting with the CMP will result in 1 individual consent decision for each Data Processing Service added to your CMP.
Example: 3 essential services and 7 non-essential services added to the CMP.
Accept all: 10 consent decisions (10 opt-ins and 0 opt-outs) → Optin-rate = 10/10 = 100%
Deny all: 10 consent decisions (3 opt-ins for essential services and 7 opt-outs) → Opt-in rate = 3/10 = 30%
How is a service assigned to a specific category?
Services will be assigned to the category they are currently placed in under service settings / Data Processing Services.
What happens if the category for a service is changed?
The graphs for Granular Analytics will be recalculated and the service will directly be considered for the new category.
Why am I not seeing any data in Granular Analytics even though the CMP is already live?
Granular Analytics is available starting CMP version 2.43.0 for Browser CMP, 4.12.0 for Browser SDK and 2.7.1 for App SDK. In case you still don't get any data displayed, please contact our support.